使用NaiveBayes进行股票涨跌预测

前言
这次我们考虑创建一个朴素贝叶斯分类器来进行股票涨跌预测,我们的分类器会根据某只股票前几日的每日的股票数据(开盘价,最高价,收盘价,最低价,价格变动,涨跌幅)来预测明天的涨跌情况。编程语言:Python3.5.2,Python库:NLTK、tushare。
数据获取
在创建分类器前我们得收集一些历史数据来作为训练集。Python的tushare是一个非常方便的获取股票数据的库,它的api使用起来也非常简单,详情你可以访问它的官网:http://tushare.org/。注意笔者在Python3.5.2上安装tushar库时发现,安装tushare前要先安装pandas、lxml和requests这3个库。如果你不想安装tushare,你可以使用我下载好的数据集猛戳我。
下载好的数据如下所示:

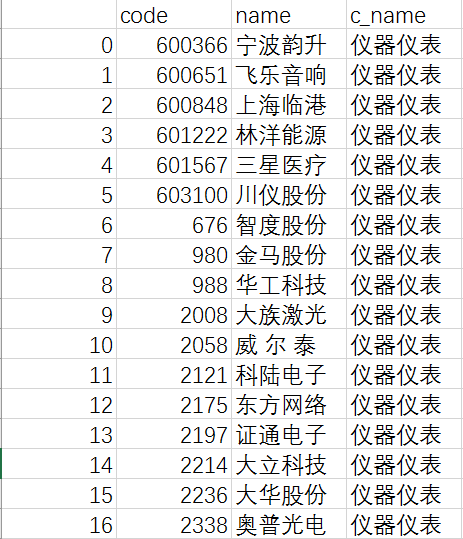
stock_industry.cvs中存储了股票的行业信息,文件详细内容如下:
code为股票代码,name为股票名称,c_name为行业名称
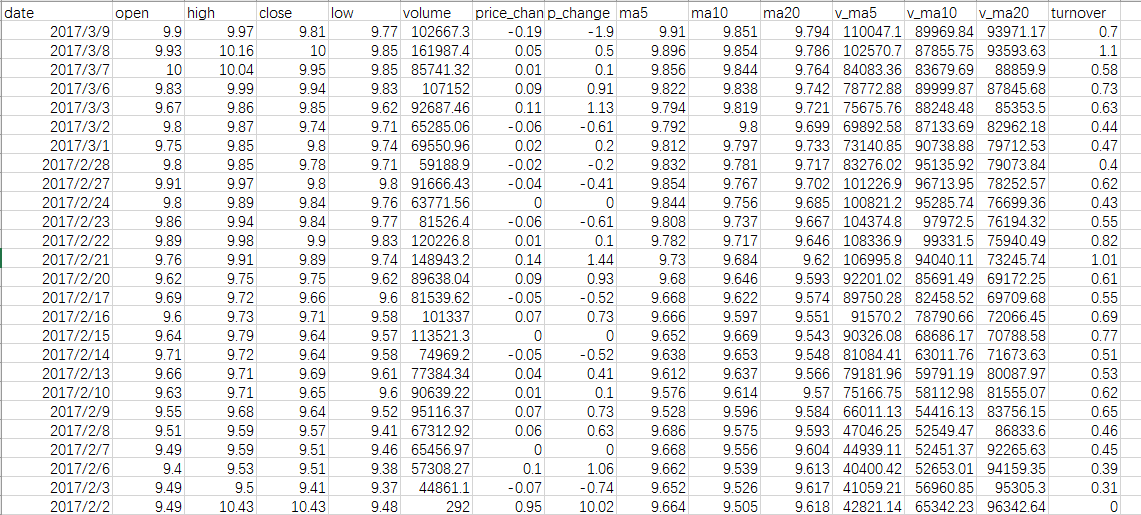
其他每一个文件就是一个股票的详细数据,我只收集了电子信息行业的股票数据,它包含了大概15万条数据。因为我觉得股票涨跌可能和行业也有一定的关系,所以我们只针对某一行业建立模型。股票文件的详细内容如下:
data(日期),open(开盘价),high(最高价),close(收盘价),low(最低价),price_change(价格变动),p_change(涨跌幅百分比)
使用thshare下载股票数据代码如下:
    import tushare as ts


    def stock_industry_download():
        """
        下载股票行业分类数据
        """
        df = ts.get_industry_classified()
        df.to_csv('../Data/stock_industry.csv')


    def stock_industry_load(file_name):
        """
        加载股票行业分类信息
        :param file_name: 文件名
        :return: {'行业名':[('股票代码', '股票名'), ...]}
        """
        stock_industry = {}
        file = open(file_name)

        is_first_line = True
        for line in file:
            if is_first_line:
                is_first_line = False
                continue
            prop_list = line.split(',')
            industry_name = prop_list[3].strip()
            if industry_name not in stock_industry:
                stock_industry[industry_name] = []
            stock_industry[industry_name].append((prop_list[1], prop_list[2]))

        file.close()
        return stock_industry


    def industry_stock_download(name):
        """
        下载某一行业的所有股票数据
        :param name: 行业名称
        """
        industry_data = stock_industry_load('../Data/stock_industry.csv')
        for stock in industry_data[name]:
            stock_code = stock[0]
            stock_name = stock[1]
            print(stock_code)
            print(stock_name)

            df = ts.get_hist_data(stock_code)
            df.to_csv('../Data/%s-%s-%s.csv' % (name, stock_code, stock_name))

    if __name__ == '__main__':
        industry_stock_download('电子信息')
股票数据加载
我们先写一个股票数据加载的函数:
该函数会从股票数据文件中加载我们感兴趣的数据,返回一个数据列表,列表中越新的数据越靠前
    def stock_load(file_name):
        """
        从指定数据文件中加载股票数据
        :param file_name: 文件名
        :return: 数据列表[(开盘价, 最高价, 收盘价, 最低价, 价格变动, 涨跌幅)]
        """
        stock_list = []
        file = open(file_name)

        is_first_line = True
        for line in file:
            if is_first_line:
                is_first_line = False
                continue
            prop_list = line.split(',')
            open_price = float(prop_list[1])
            high_price = float(prop_list[2])
            close_price = float(prop_list[3])
            low_price = float(prop_list[4])
            price_change = float(prop_list[6])
            p_change = int(float(prop_list[7]))
            stock_list.append((open_price, high_price, close_price, low_price, price_change, p_change))
        file.close()
        return stock_list
股票数据切割
上面函数返回的股票数据是按照时间顺序排列的,然而我们需要的是某一天股票涨跌和它前几日的数据,所以我们完成一个切割函数如下:
我们将涨的股票标记为'+',跌的股票标记为'-'
    def stock_split(data_list, days=5):
        """
        股票数据分割,将某天涨跌情况和前几天数据关联在一起
        :param data_list: 股票数据列表
        :param days: 关联的天数
        :return: [([day1, day2, ...], label), ...]
        """
        stock_days = []
        for n in range(0, len(data_list)-days):
            before_days = []
            for i in range(1, days+1):
                before_days.append(data_list[n + i])

            if data_list[n][4] > 0.0:
                label = '+'
            else:
                label = '-'
            stock_days.append((before_days, label))

        return stock_days
股票数据特征提取
原始的数据是不能作为朴素贝叶斯分类器的特征值的,我们完成一个特征提取函数它会从前几日的数据中提取特征值:
每一天的数据中提取7个特征,包括股票是否涨,当天最高值和开盘价收盘价的比较,当天最低值和开盘价收盘价的比较等
    def stock_feature(before_days):
        """
        股票特征提取
        :param before_days: 前几日股票数据
        :return: 股票特征
        """
        features = {}
        for n in range(0, len(before_days)):
            stock = before_days[n]
            open_price = stock[0]
            high_price = stock[1]
            close_price = stock[2]
            low_price = stock[3]
            price_change = stock[4]
            p_change = stock[5]
            features['Day(%d)PriceIncrease' % (n + 1)] = (price_change > 0.0)
            features['Day(%d)High==Open' % (n + 1)] = (high_price == open_price)
            features['Day(%d)High==Close' % (n + 1)] = (high_price == close_price)
            features['Day(%d)Low==Open' % (n + 1)] = (low_price == open_price)
            features['Day(%d)Low==Close' % (n + 1)] = (low_price == close_price)
            features['Day(%d)Close>Open' % (n + 1)] = (close_price > open_price)
            features['Day(%d)PChange' % (n + 1)] = p_change

        return features
训练模型
我们先从股票行业信息文件中加载某一行业的所有股票代码和名称,然后分别加载该行业的每只股票的数据,把数据集分割为训练集和测试集,之后使用贝叶斯分类器进行训练
    def train_model(industry_name):
        """
        训练模型
        :param industry_name: 行业名称
        """
        stock_industry = stock_industry_load('./Data/stock_industry.csv')
        electronic_stocks = stock_industry[industry_name]

        stock_days = []
        for stock in electronic_stocks:
            file_name = './Data/%s-%s-%s.csv' % (industry_name, stock[0], stock[1])
            stock_data = stock_load(file_name)
            stock_days += stock_split(stock_data)

        print(len(stock_days))
        random.shuffle(stock_days)
        train_set_size = int(len(stock_days) * 0.6)
        train_stock = stock_days[:train_set_size]
        test_stock = stock_days[train_set_size:]

        train_set = apply_features(stock_feature, train_stock, True)
        test_set = apply_features(stock_feature, test_stock, True)

        classifier = nltk.NaiveBayesClassifier.train(train_set)
        print(nltk.classify.accuracy(classifier, train_set))
        print(nltk.classify.accuracy(classifier, test_set))

        classifier.show_most_informative_features(20)

    if __name__ == '__main__':
        train_model('电子信息')
以上代码运行结果为:
151491
0.5528527735604111
0.5484429922273379
Most Informative Features
Day(1)PChange = 10 + : - = 2.2 : 1.0
Day(1)PChange = -10 - : + = 1.8 : 1.0
Day(1)High==Close = True + : - = 1.5 : 1.0
Day(1)PChange = 9 + : - = 1.5 : 1.0
Day(1)PChange = -6 + : - = 1.4 : 1.0
Day(4)PChange = -8 + : - = 1.3 : 1.0
Day(5)PChange = -5 + : - = 1.3 : 1.0
Day(2)PChange = -3 + : - = 1.3 : 1.0
...
在训练集和测试集上我们的准确率分别为55%和54%,只比随机猜测好一点点,说明股票不是那么好预测的,哈哈。另外前一天的涨跌对结果的影响稍微大一点,前一天大涨的话第二天涨的概率会高一点。
后话
股市有风险,入市需谨慎。以上内容仅供娱乐。


还没有人评论...